
If you want to beef up your content marketing strategy, it’s not enough to rely on the same techniques over and over again. You want to make sure that you are continually improving, reaching the right people, and hitting (maybe even surpassing) industry benchmarks.
Industry benchmarking is a powerful way to help you distinguish which marketing practices you should adopt or stop using. It allows you to gauge your competitors’ performance using analytical data accurately. You can then use this data to interpret performance factors, predict trends, and ensure your strategy is up-to-date with modern consumer demands.
Analyzing whether or not your company is on par with industry benchmarks is imperative. It helps weed out the tactics that need improvement or eliminate those that are no longer useful. It also helps your team set goals and provides insight into how much more you can do with your upcoming campaigns.
Many tools can help automate the benchmarking process. However, the data needs to be analyzed and understood. The first step is to determine the areas you want to track. For instance, if you have a personal blog, you may want to focus on website traffic, bounce rate, and time spent on your site.
Let’s discuss some of the most common metrics you should know, what they track, and the average benchmark across multiple industries.
How to Benchmark Your Content Performance
Conversion Rate
Your conversion rate is the percentage of your audience who convert to customers. Usually, high conversion rates mean that your marketing strategies are successful. Lander reports that the average landing page conversion rate across all industries is 2.35%. However, don’t be complacent as values vary per sector.
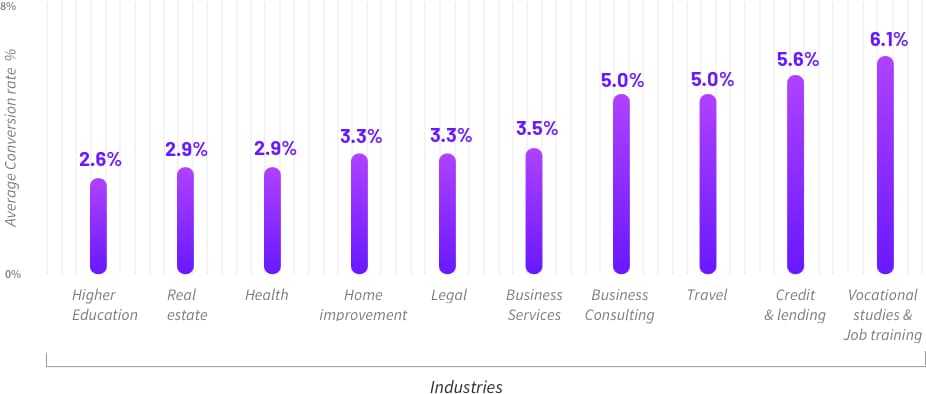
According to a study released by Unbounce, the top industries with the highest percentage of conversion rates are vocational studies and job training (6%) and business services (5.5%). Higher education (2.6%) and real estate (2.9%) are on the lower end of the spectrum. Note that even the lowest figures cited are higher than the global average percentage.
Bounce Rate
Bounce rate is the percentage of your page visitors who leave without exploring the other pages of your website. They may have even opened a piece of sponsored content but closed it immediately after seeing the first page. Ideally, bounce rates should not be too high. You want your audience to stay on your website and navigate to other pages.
Digishuffle shared their 2017 bounce rate benchmark reports and showed that the industries with low bounce rates are real estate (49.25%), shopping (47.85%), and automotive (46.34%). No doubt, visitors to these pages surf through many products offered on the same site. After all, the end goal is to purchase during each session.
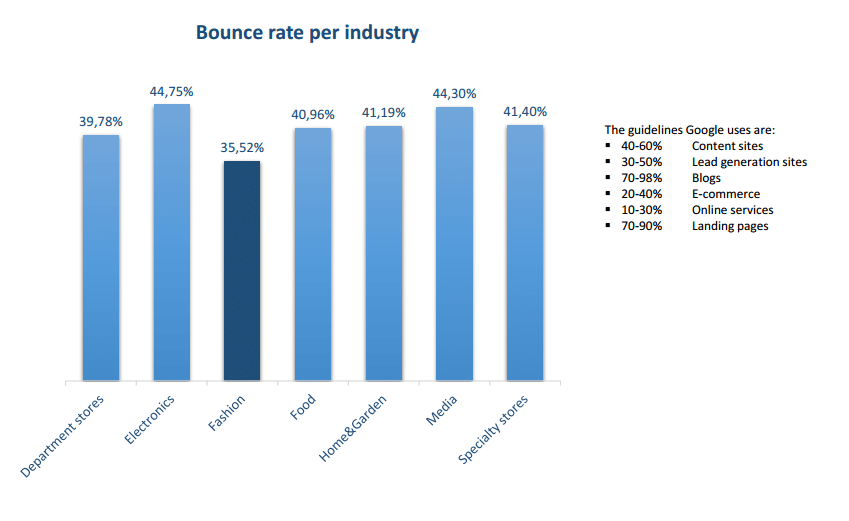
It’s different for blogs and entertainment websites, however. They have a higher bounce rate of 76.47%. The market behavior for this industry indicates that a user tends to consume a single piece of information and then continue with their day.
Average Session Duration
How much attention are your readers giving you? This varies by what kind of content you produce. If you have a lot of text-heavy articles, you can expect that the average time is longer—unless they didn’t understand your message, got bored, and left before they finished reading your content.
The more time spent, the better. Brafton pooled the statistics of 181 websites from 2015 to 2016 and deduced that the average session a visitor stays on a site is 2 minutes and 17 seconds. The outlier here was the hospital and healthcare industry, racking up 3 minutes and 38 seconds.
The difference is enormous compared to lifestyle blog posts which only get an average of 1 minute and 20 seconds of screen time, which reveals why that industry has relatively high bounce rates.
CTR (Click-through Rate) and CPC (Cost Per Click)
All companies want high CTRs. It’s the immediate response of your audience when they see an ad that piques their interest. It sends a message that your ad is compelling and you can maximize your ad’s placement and budget. Related to that is CPC. That’s the amount marketers pay for each click gathered by advertisements on search engines like Google, Yahoo!, or Bing. The lower you pay, the better.
Wordstream released a graph of the average CTR of ads in Google AdWords. Dating and personal services have the highest percentage at 3.40%, with legal services garnering a minuscule amount at 1.35%. Keep in mind that the average for all industries is 1.91%.
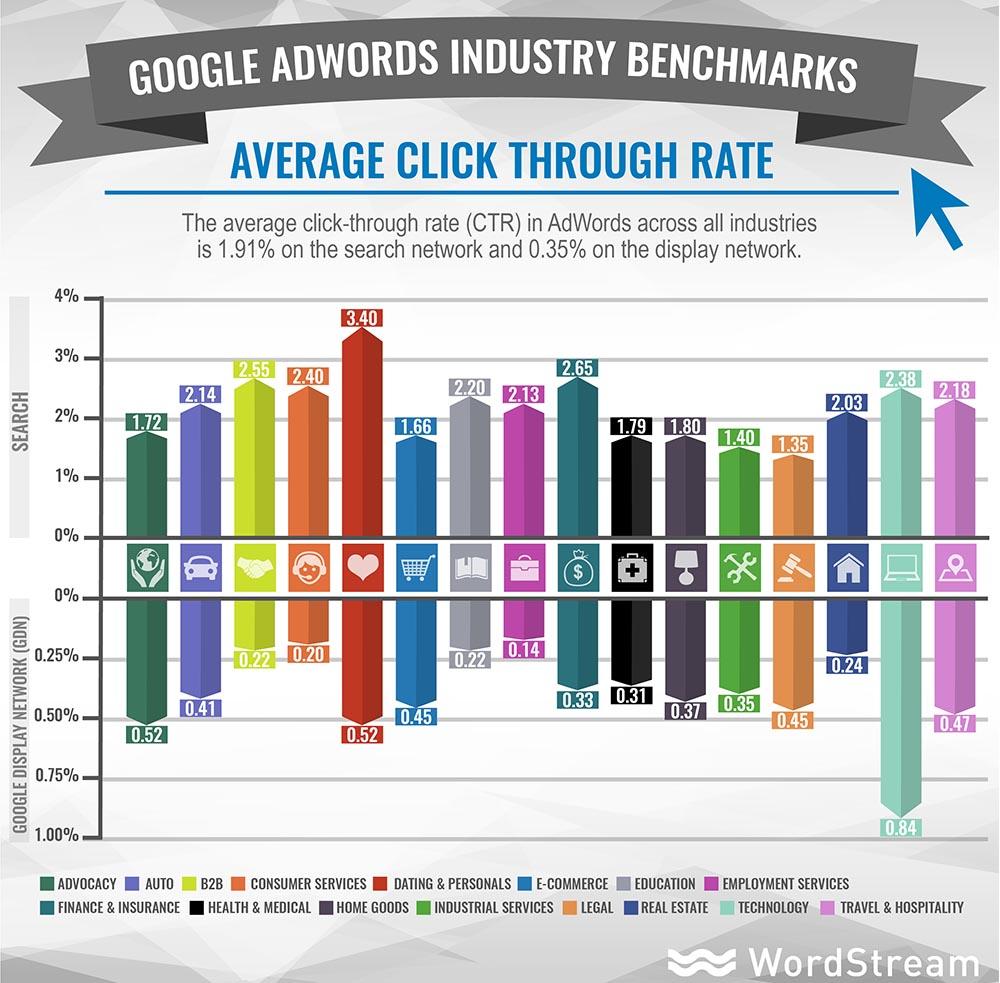
CPC data shows that dating websites have a low CPC of $0.19, which justifies their high CTR. Similarly, legal ads pay a hefty $5.88. The average CPC for all industries is $2.32.
When analyzed, dating websites have a lot of creative freedom regarding copy, as they capitalize on human emotion. On the other hand, legal services have a more challenging time due to the demands of their professions and some restrictions enforced by Google and government entities.
It’s important to regularly keep track of this data and see how you can improve your CTR and CPC.
Email Marketing
Email is not dead. Email is an incredibly powerful marketing tool now more than ever. There’s a lot of data to look at with email marketing analytics, with the most notable figures being open and click rates.
You want to pay attention to which emails consumers are opening. It usually has something to do with an enticing email headline and brand recall. If the receiver is a fan of your brand, they will give your message the time of day.
MailChimp shared that the industry-wide open rate average is 20.81%. The top performers were emails related to hobbies (27.35%), government entities (26.52%), and the arts (26.03%).

On the other hand, click rate refers to the number of people who clicked links on your email. How enticing is your product? The top three industries were hobbies (4.78%), media (4.55%), and government (3.65%). The average for all sectors is 2.43%.
Final Thoughts
Benchmarks keep you on track. With the ease of recording data through services like Google AdWords, Google Analytics, and Facebook Ads, it’s no excuse not to pay attention to the figures. Working with data will help improve your brand’s presence and your whole content marketing strategy.
Related Blogs

What is Content Syndication? The Key to Generating Leads and Increasing Conversions
Content syndication is the act of republishing your content to other websites, introducing it to new audiences and…
Read More
Mastering Campaign Measurement: A Guide for B2B Marketers
Measurement is crucial for any marketing or advertising campaign to assess whether your investment paid off. Here are…
Read More
The Hidden Perils of B2B Data Deprecation: A Marketer’s Guide
In B2B marketing, accurate data is essential for success. However, data quality can decline over time due to…
Read More
10 B2B Growth-Hacking Tactics for Lead Generation
Growth hacking is one of the most wide-spread “secrets” of small business start-ups. Its meaning can sometimes get…
Read More
An Inquiry vs. a Lead: What’s the Difference?
Many marketers and sales people assume that inquiries and leads are one and the same, but in fact,…
Read More
10 Examples of Awesome Landing Pages that Convert
To lead more users to your products, you need to create a showstopping landing page. To do this,…
Read More
Lead Quantity vs Lead Quality: Achieving a Balance
Traditional sales and marketing strategies have long focused on lead quantity by casting a wide net to capture…
Read More
What Data Solutions Mean for Marketing Technology?
In recent years, marketing has come to rely on the input of big data in order to create…
Read More
PureBits: Lessons on Life & Sales
Selling is tough. There are many buying signals that a salesperson should watch out for to help them…
Read More
How To Create A Super Engaged Audience For Your Brand
The use of hashtags has become so prominent in content, particularly on social media, that it has penetrated…
Read More
Why Quality Leads are Expensive
Getting more leads at a lower cost is always at the top of lead generation objectives, especially for…
Read More